Research-based estimates of net water savings from removing an unused swimming pool
Studies of swimming pool removals have produced estimates of the average annual water savings from filling an unwanted swimming pool. The two different approaches taken are described below.
The Engineering Estimate is based on a set of measurements and reasonable assumptions made about pools that have been removed. It represents the sum of 9 different water use factors:
| Water Use Description | Annual Gallons Saved |
|---|---|
| Evaporation = 62” of pond evap × 500 sq ft pool | 19,323 |
| Minus 12” annual precipitation × 500 sq ft pool | - 3,740 |
| Plus emptying & refilling every 5th year × 15,000 gals volume | + 3,000 |
| Plus backwashing sand filters = 400 gals × 24 backwashes | + 9,600 |
| Minus irrigation of replacement landscape, 12” × 50% land cover | - 2,600 |
| Minus infrequent pool cover usage in spring & fall × evap rate | - ??? |
| Plus unknown losses from pool leaks | + ??? |
| Plus unknown losses from pump/filter system leaks | + ??? |
| Equals total annual net water savings: | 26,313 plus leaks |
This approach requires making assumptions about the average size and depth of removed pools, the type of pool filter, pool cover usage, the types and amount of landscaping installed after the pool is removed, and the frequency and size of pool leaks. The estimate of 26,313 gallons/year or 35 CCF/year is considered a lower bound, because many older pools are suspected of having significant leaks.
The Statistical Analysis of water savings from pool removals relies instead on looking at monthly water use for a set of households where pools were removed, both before and after removal. This approach eliminates the effects of differences between homes with pools and those without, and also accounts for year-to-year differences in weather. The steps are:
- Identify pools that were full but are now removed;
- Use remote sensing to determine time periods when the pool was full vs. empty or removed;
- Use monthly billing records to calculate daily residential water demand for periods beginning at least one year before the pool was removed and continuing for at least one year after removal;
- Use time series – cross sectional analysis to estimate the monthly difference in water demand between full pools vs. empty/removed pools.
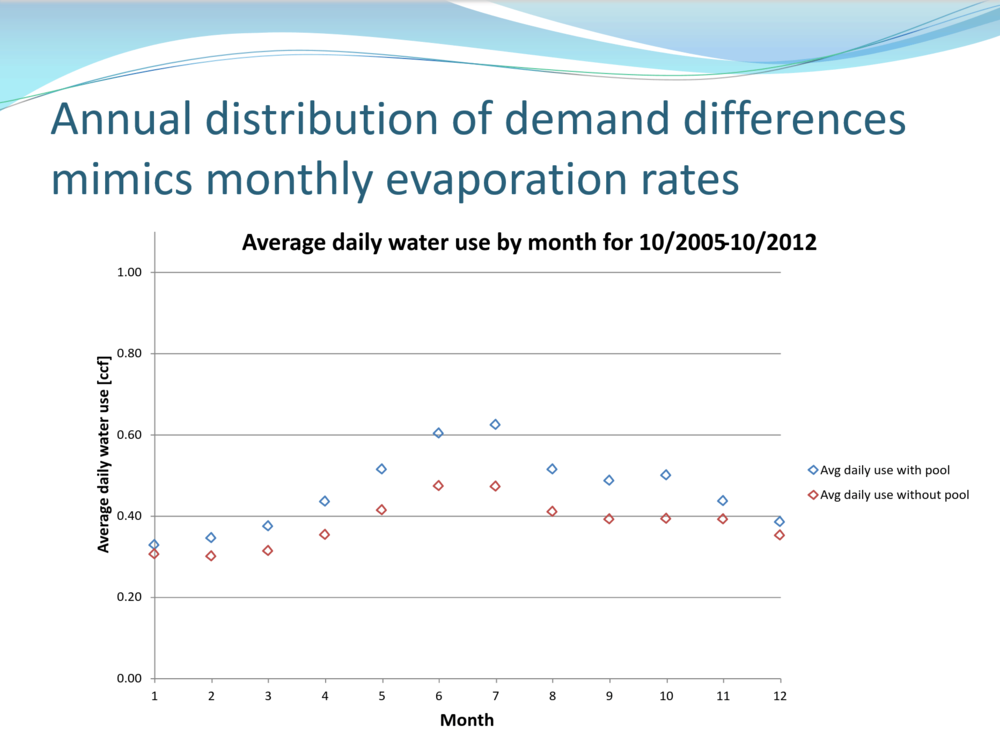
This graph shows the results of the analysis, with the gap between the values for “with pool” and “without pool” use showing the water savings by month of year. As expected, the savings are greatest in summer months.

Total average annual water savings is 34,401 gallons. Note that this includes a small number of pools whose water use was unusually high, suggesting they had major leaks. Removing these outliers results in annual water use of 29,213 gallons. The two estimates are reasonably close:
Engineering estimate: 26,313 gallons + unknown leaks
Statistical estimate: 29,213 gallons + 5,188 gallons in leaks